
Bitcoin is at a crossroads. And you can feel it in the way traders are arguing right now.
On one side, you’ve got people saying we’re about to see a massive crash down to $60K. On the other hand, you’ve got bulls calling this nothing more than a dip before we rocket toward $140K.
Which camp are you in?
Here’s the reality: after peaking around $124,600, Bitcoin has already dropped about 12%. That’s not small change. And if you’ve been watching the charts like I have, you’ll know the warning signs are there. The weekly chart is showing a bearish RSI divergence — basically, price was pushing higher, but buyers were running out of steam.
Some analysts aren’t panicking. They see this as a healthy correction, the kind of shakeout that clears leverage and resets the market. With the Fed talking about possible rate cuts, bulls argue the macro picture still favors higher prices.
So who’s right?
In this post, we’ll break down the charts, weekly, daily, 4H, and even the Bitcoin liquidation heatmap, and map out what these setups really mean for you. Whether you’re bracing for $60K or waiting on $140K, the next move is going to matter.
What’s Really Happening on Bitcoin Chart
Bitcoin Weekly Chart
On the weekly chart, Bitcoin is flashing a warning sign. RSI divergence is active, which basically means price was climbing but momentum was fading. That’s not a minor detail, it’s often the first clue that the rally is running out of gas.
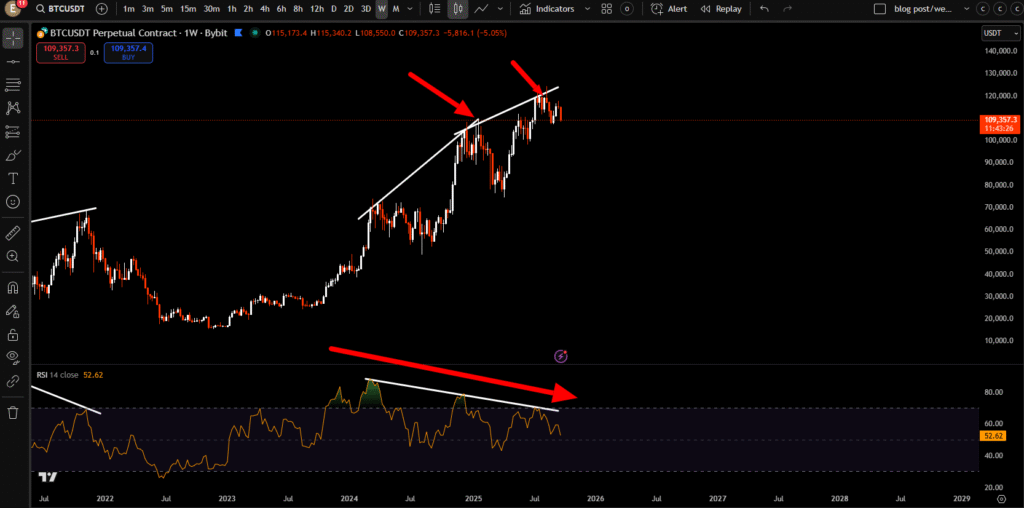
Right now, price is hovering around $109K, but the real battle zones are clear:
- Resistance: $115K–$118K
- Support: $105K–$100K (if this breaks, things get heavier)
- Deeper structural support: $92K–$95K
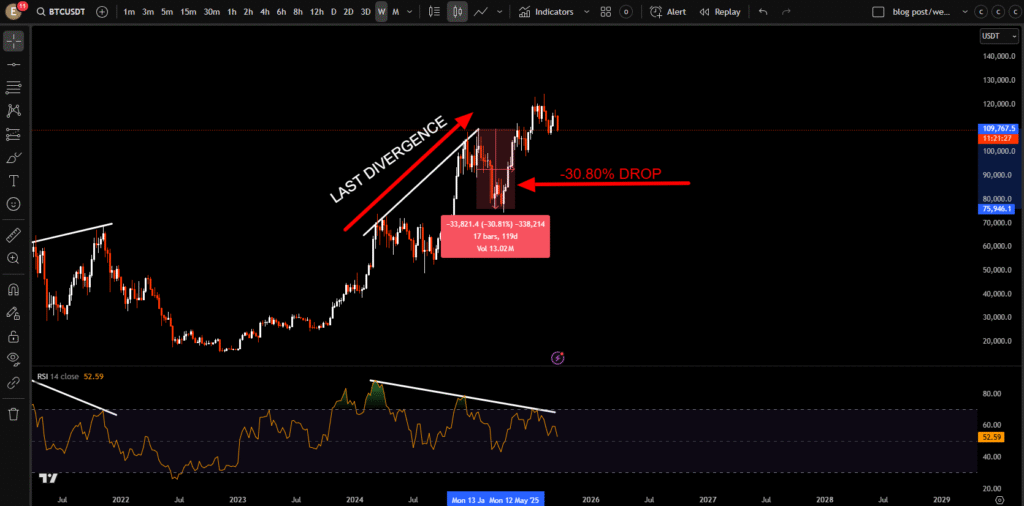
The last weekly Bitcoin bearish divergence that we saw play out on the weekly Bitcoin price chart was between these two highs($71,500 and $104,500) right here, between, obviously the price and the RSI.
And what came next was a major pullback of -30.59%. We might see the same result, a major cool off over the next multiple months but not necessarily the end of the bull market. So keep that in mind. We’re still playing this out, a -13.715 already, but technically, we have not yet confirmed the end of the bull market.
Bitcoin Daily Chart Analysis
Now, zoom into the daily chart. We’re still holding just above the Fibonannaci level of 0.618, in this crucial area of support: $106,700 and $107,600. And so obviously, it will be important for the price to hold this as support or bounce from here, in order to keep the daily higher low intact.
So far, BTC is holding above it, which is good news for the bulls. But if we break below this area, we’d be breaking below an important Fibonacci area on the price chart and would be creating a lower low on the daily timeframe, which obviously would not be good.
That would be a bearish price structure. On the upside, any bounce faces resistance at $111.4K and $114.5K. So even if we get a pop, it’s going to have to clear those walls first
Bitcoin 4-Hour Chart Analysis
Drop down again to the 4-hour chart, and clearly the short-term momentum is still very bearish. But even though yes, we are within a short-term bearish trend, we’re now also forming a bullish divergence.
But with that being said, we’ve not really seen a lot of confirmation. Sellers are losing steam, even though prices is making lower lows.
That’s often a clue the market wants to stabilize, maybe even bounce. Still, don’t expect fireworks right away. More likely, we’ll see some sideways chop before anything big happens.
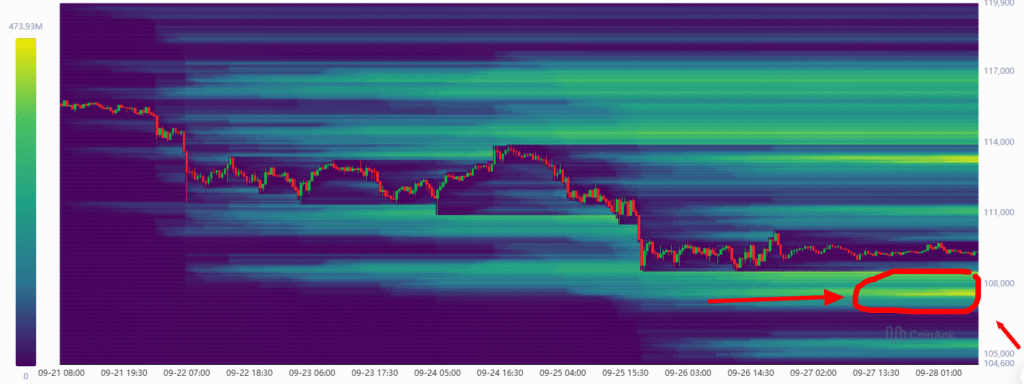
Bitcoin Liquidation Heatmap
if we’re taking a look at the Bitcoin liquidation heat map, we can actually see new liquidity building just below the price of Bitcoin. We have this new area building at around just above 107,500, at around 108K.
The Opportunity (or Risk) You’re Missing
Here’s the thing about Bitcoin right now: depending on how you look at the charts, you can build a solid case for either a painful drop or a monster breakout. That’s why traders are split — and why you need to be prepared for both.
The Bearish Case – Downside to $95K… or Even $60K
The weekly chart is waving two red flags: a bearish RSI divergence and a rising wedge breakdown. That combo has a history of leading to serious pullbacks.
If BTC fails to hold the $108K–$105K support range, the next magnet is $95K–$92K — a key structural zone from earlier consolidation. Lose that, and things open up for a deeper slide toward $80K.
That’s not FUD. It’s just what the technicals are hinting at. Remember, in 2021 Bitcoin ripped to new highs and then retraced over 50% when momentum cracked. Could history repeat? Possibly.
The Bullish Case – Bounce Toward $140K
What if this isn’t the end of the bull cycle at all? Some analysts argue we’re just in a healthy correction. Shake out the leverage, reload liquidity, and then send it higher.
The daily chart supports this view. If $108K holds firm, BTC could bounce back to $111.4K, then $114.5K. Get a strong push above $113K–$115K, and suddenly the door opens toward $140K. Add in macro factors like potential Fed rate cuts and improving liquidity, and the bullish story doesn’t sound crazy.
The Middle Ground – Chop Before the Big Move
Of course, there’s a middle path.
Instead of collapsing or mooning, Bitcoin could just range between $105K and $115K for weeks. That would line up with the 4H chart showing a bullish divergence, but no real breakout strength yet. Sideways price action like this often feels boring, but it’s how the market builds the base for the next decisive move.
So here’s the opportunity — and the risk. If you’re positioned for only one outcome, you’re gambling. If you’re watching both sides and managing risk, you’re trading.
Your Action Plan
So, where does this leave you as a trader? Let’s keep it simple.
Step 1: Watch the $108K Line Like a Hawk
This is the line in the sand.
- If BTC holds above $108K, you’ve got a case for a bounce toward $111K–$114.5K.
- If it breaks below with volume, expect the slide to $105K–$102K, maybe even $95K.
That single zone will tell you a lot about where the next move is headed.
Step 2: Look for Confirmation on the 4H Chart
Yes, there’s a bullish divergence forming, but don’t jump in too early.
- Wait for at least 2–3 strong 4H candles closing with higher lows on both price and RSI.
- Without that, you’re just guessing. With confirmation, you’re trading a real signal.
Patience here is key.
Step 3: Don’t Fall for the Stop Hunt
Liquidity is stacked at $107.5K–$108K. That means we could dip into that range just to wipe out weak hands before bouncing.
Translation: don’t panic if price stabs lower for a moment. The market loves to clear liquidity before showing its real direction.
👉 Bottom line: stay flexible. Don’t marry the $60K or $140K narrative. Instead, trade the levels in front of you, respect your stops, and let the market pay you for discipline.
👉 If you want to see the exact levels I’m watching in real time, I share them daily inside my Telegram group. Join here and get the heatmap zones, chart screenshots, and setups before the crowd. Don’t trade blind — trade with a plan.